



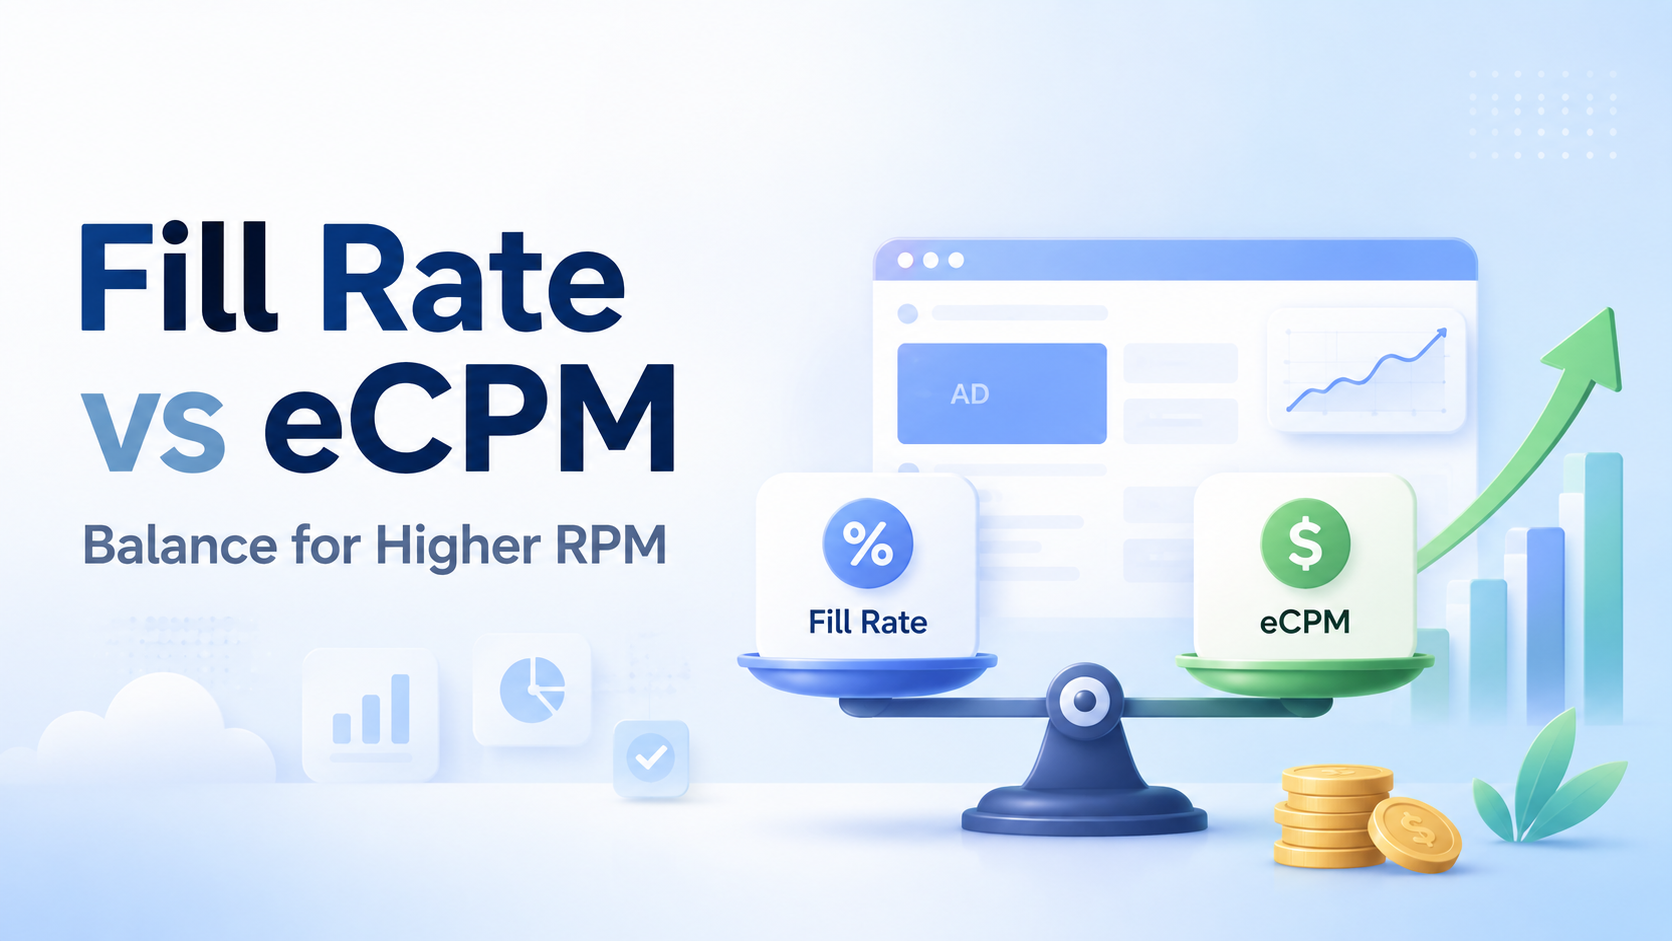
A high eCPM can look impressive in a revenue report, but it does not always mean a publisher is earning more. If higher bid prices come with a sharp drop in filled impressions, a large share of valuable inventory may generate no revenue at all. This is the core challenge behind fill rate vs eCPM optimization.
Publishers therefore need to evaluate yield across the full inventory pool, not only the impressions that won an auction. Floor prices, demand coverage, bidder performance, ad formats, and inventory quality all affect the final result.
The goal is to find the point where enough impressions are sold at competitive prices to maximize total revenue. That means looking beyond eCPM and using fill rate, revenue per ad request, and Page RPM together.
Table of Contents
The vanity metric trap: Why a high eCPM can kill your total revenue
A publisher sees an average eCPM of $10 and assumes the monetization setup is performing well. But if only 30% of eligible ad requests receive a paid impression, the remaining 70% produces no direct advertising revenue.
This is why eCPM should never be evaluated alone.
Using the standard definition of eCPM, a simplified revenue formula is:
Revenue = (Ad requests × Fill rate × eCPM) / 1,000
For example, 100,000 requests at a $6 eCPM and 35% fill rate generate: 100,000 × 35% × $6 / 1,000 = $210
A lower eCPM can produce more money if considerably more inventory is sold.
Publishers should also separate page RPM vs eCPM when reviewing performance. eCPM measures the value of monetized impressions. Page RPM measures revenue relative to pageviews, so it reflects more of the visitor experience, including how many monetizable opportunities each page generates.
A publisher can therefore increase eCPM while Page RPM falls if stricter floors create too many unfilled impressions.
Inventory structure also influences this balance. A content website, utility site, H5 game portal, or image-heavy publisher may require different formats and demand strategies.
Internal link: Website monetization by vertical: How to match your site niche with the right ad formats
The fundamental relationship between floor pricing, fill rate, and eCPM
The basic relationship behind balancing fill rate and eCPM is similar to price elasticity. Raising the minimum acceptable price reduces the number of buyers that can compete successfully.
Higher floors can improve winning prices
Increasing floor prices may filter out low-value bids and raise the average eCPM of impressions that are eventually sold.
This approach can work well for high-viewability inventory, premium placements, strong GEOs, or audiences that regularly attract competitive advertiser demand.
However, the benefit disappears when the floor becomes higher than what the market is willing to pay. More auctions then end without an eligible bid, causing fill rate to fall.
Lower floors increase demand eligibility
Reducing floors allows more bids to participate and normally gives publishers a better chance of filling inventory.
But setting floors too low across every impression can also leave money on the table. Premium inventory may clear at prices significantly below what buyers would have paid under a better pricing strategy.
The objective is therefore not 100% fill at any price.
The optimal yield point
The best yield usually sits somewhere between these two extremes.
Publishers need to test where changes in floor price stop generating enough additional eCPM to compensate for lost impressions. This point can differ by GEO, device, placement, format, time of day, traffic source, and audience segment.
Effective fill rate vs eCPM optimization therefore requires segmentation rather than one universal floor across an entire site.
Scenario analysis: High eCPM vs. high fill rate vs. balanced yield
Consider a publisher generating 100,000 ad requests under three different pricing strategies:
| Metric | Scenario A: Aggressive floors | Scenario B: Very low floors | Scenario C: Balanced yield |
|---|---|---|---|
| Total ad requests | 100,000 | 100,000 | 100,000 |
| Average eCPM | $6.00 | $1.50 | $3.50 |
| Fill rate | 35% | 95% | 85% |
| Paid impressions | 35,000 | 95,000 | 85,000 |
| Total revenue | $210.00 | $142.50 | $297.50 |
| Revenue per 1,000 ad requests | $2.10 | $1.43 | $2.98 |
Scenario A produces the highest visible eCPM, but 65% of requests remain unfilled. The publisher earns only $210.
Scenario B sells almost every impression, but weak pricing reduces total revenue even further to $142.50.
Scenario C has neither the highest eCPM nor the highest fill rate. Yet it generates $297.50 because the publisher sells enough inventory while maintaining stronger average pricing. Revenue is approximately 42% higher than Scenario A and 109% higher than Scenario B.
This is the type of trade-off yield teams should optimize.
One technical distinction is important: the final row represents revenue per 1,000 ad requests, not automatically Page RPM. True Page RPM uses pageviews as the denominator and also depends on the number of ad opportunities generated per page.
4 actionable tactics to balance fill rate and eCPM effectively
Publishers can improve yield without automatically choosing between expensive impressions and maximum fill:
1. Use dynamic or tiered floor pricing
Avoid applying one fixed floor across every impression.
Higher floors may make sense for premium above-the-fold placements, sticky inventory, high-viewability units, or audience segments with strong buyer competition. Lower-value placements may require more flexible floors to protect sell-through.
Segment reporting by GEO, device, placement, format, and demand performance. Changes should be tested against total revenue rather than the resulting eCPM alone.
2. Build reliable fallback demand
Unfilled inventory should have a clear fallback strategy where appropriate.
Publishers can route eligible unsold opportunities toward additional demand sources, contextual alternatives, affiliate placements, or house campaigns. The purpose is not to force every impression to generate programmatic revenue, but to avoid losing monetizable opportunities unnecessarily.
Fallback logic should remain simple enough to avoid excessive latency or long auction chains.
3. Optimize Prebid timeout and bidder density
More competition can improve both bid coverage and pricing, but adding bidders without control can slow the page and create auction inefficiency.
For many publishers, testing approximately 5 to 8 relevant SSPs is a practical starting point. Prebid timeout ranges around 800 to 1,200 milliseconds can also be tested, although the correct value depends on device performance, traffic geography, bidder response times, and page-speed targets.
Track bid rate, timeout rate, win rate, revenue, and latency together. A bidder that rarely returns a competitive bid may add complexity without improving yield.
4. Expand eligible sizes and formats
Multi-size ad units give more creatives an opportunity to compete for the same placement.
For example, a compatible rectangle slot may accept both 300×250 and 336×280 creatives. Responsive size mapping can also change eligible dimensions between desktop and mobile.
Multi-format setups can extend competition further, but display, native, and video demand need to be configured correctly rather than simply added to the same slot.
For publishers without dedicated in-house yield teams, managed monetization partners such as PubFuture can also help review demand coverage, bidding configuration, ad formats, and inventory segmentation as one connected system instead of optimizing each metric separately.
How to diagnose whether your ad stack has a fill rate or eCPM problem
Ad inventory fill rate troubleshooting becomes easier when publishers identify which metric is actually limiting revenue.
Signs of an eCPM problem
A consistently high fill rate with weak revenue often suggests that inventory is being sold too cheaply.
Typical signals include:
- Fill rate stays close to 95% or higher: Almost every impression receives demand, leaving limited evidence of buyer scarcity.
- eCPM remains weak across valuable placements: Strong inventory is clearing at similar prices to lower-value placements.
- Page RPM remains low despite healthy traffic: More impressions are being served, but their value is insufficient.
Possible actions include reviewing floor prices, introducing stronger demand competition, improving viewability, testing additional premium formats, or integrating Prebid where appropriate.
Signs of a fill rate problem
A strong displayed eCPM combined with large volumes of unfilled requests normally points in the opposite direction.
Warning signs include:
- Unfilled ad requests exceed 25% to 40%: A significant percentage of inventory is not monetizing.
- eCPM rises sharply after floor increases: Higher prices may simply reflect the removal of lower bids rather than real revenue growth.
- Revenue per pageview declines: The publisher earns more per sold impression but less from the total audience.
The first response should be to examine pricing rules, bid coverage, demand availability, timeouts, and fallback options.
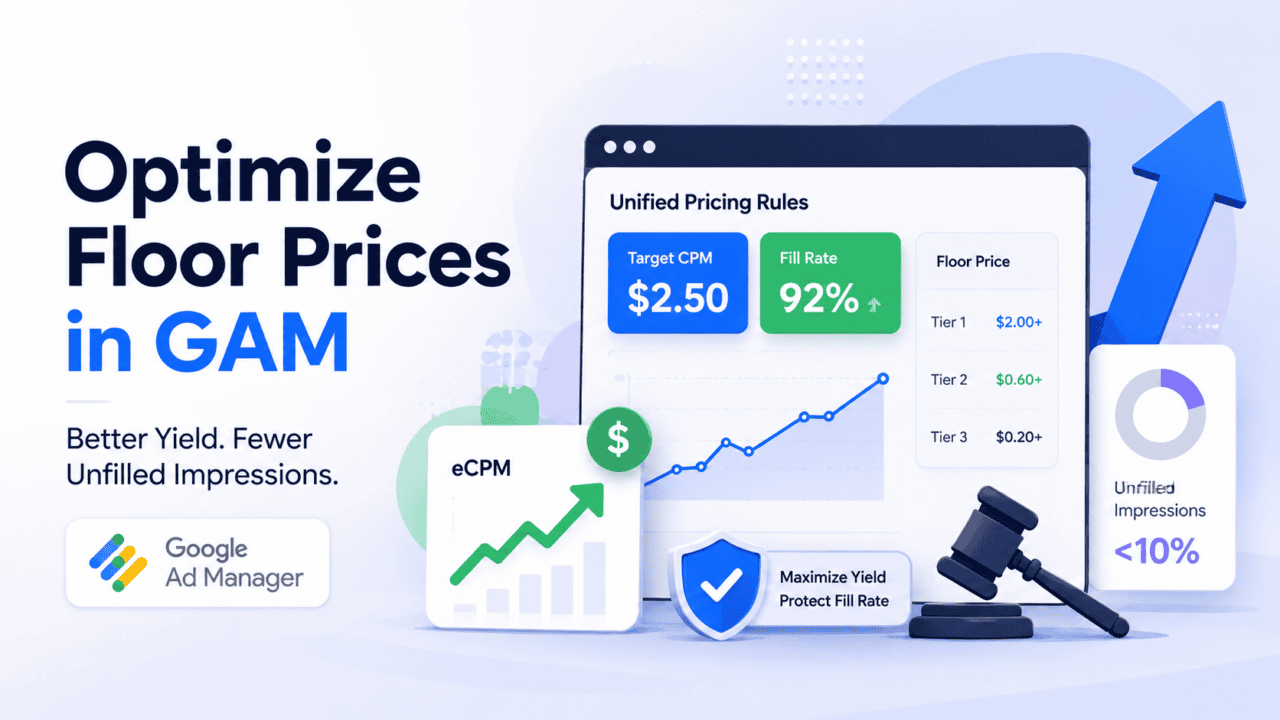
Read more: How to optimize UPR and floor prices in Google Ad Manager to boost yield
What to measure when maximizing programmatic ad revenue
A useful yield management formula for publishers needs more than one KPI. At minimum, monitor the following metrics together:
- Fill rate: Shows how much eligible inventory receives a monetized impression. Segment it by ad unit and demand source rather than relying only on the site-wide average.
- eCPM: Shows the average value of monetized impressions. Use it to understand pricing strength, but not as the sole revenue target.
- Revenue per 1,000 requests: Helps expose whether higher eCPMs are compensating for changes in fill.
- Page RPM: Connects monetization performance to actual page consumption and is often more useful for evaluating overall publisher revenue.
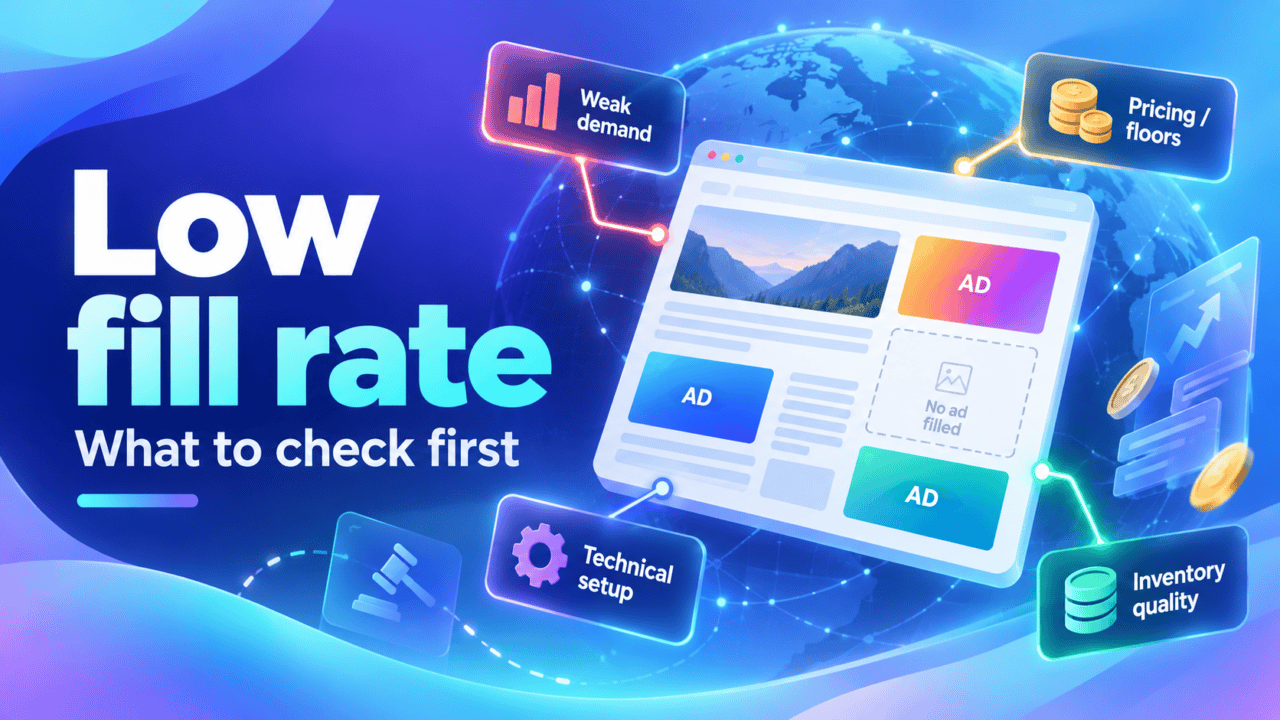
- Unfilled requests: Identifies inventory segments where pricing, demand availability, technical setup, or targeting may be restricting monetization.
The strongest optimization decision is usually the one that improves total revenue while keeping user experience and page performance stable.
Conclusion and optimization checklist
Before changing floors or adding more demand partners, publishers can use a simple optimization checklist:
- Check fill rate by ad unit, GEO, device, and format instead of relying only on site-wide averages.
- Identify placements with unusually high unfilled rates and review their floor prices.
- Compare eCPM changes against total revenue and revenue per 1,000 requests.
- Review bidder response rates and remove demand sources that add latency without meaningful bids.
- Configure compatible multi-size inventory where the page layout allows it.
- Track Page RPM before and after major yield changes.Successful fill rate vs eCPM optimization is not about pushing either metric to its maximum. Publishers should find the combination of pricing, demand coverage, and sell-through that produces the highest sustainable revenue from their traffic.For publishers looking to improve yield across a more complex ad stack, PubFuture can help evaluate monetization opportunities, demand competition, and revenue optimization across web inventory. Explore partnership opportunities with PubFuture to identify where your current setup may be leaving revenue unclaimed.


Hey very nice blog!
I got this web site from my buddy who told me concerning this site and now this time I am browsing this site and reading very informative articles
here.